Debugging information and visual studio
Without debugging information there is no debugging. By default debugging information is included when you build your project with the Debug configuration.
Configuring debug information
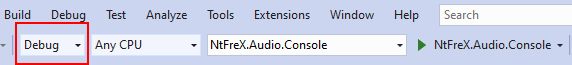
When you create a new project with .NET, Visual Studio provides two default build configurations in your project. Debug and Release. A solution build configration defines which projects are built and deployed for which target platform (x86, x64 or Any CPU) although the platform can be overwritten by the project build configuration. The solution file (.sln) holds the values you configured. A project build configuration can define anything you can configure in the project file (.csproj). But they are mainly used to configure the target platform, if the output should include debugging information and if the complier should optimize the code. When debugging information is included the default (Portable for .NET Core and Pdb-only for .NET) is that a seperate symbol file is beeing created (.pdb) but you can also choose to embed the data into the assembly you create (Executable (.exe) or Dynamic Link Library (.dll)). You do not need to explictly configure the defaults in a solution or project file, the compiler has those baked in.
Other often used features include:
- Define
DEBUGconstant - Warning level
- Treat warnings as error
Loading debug information
If you want to debug the assembly you need to have built the assembly with debugging information and then load this information. So either you have embeded the data into the assembly or you need the beloging symbol file. It would also be preferable if the the code was not optimized as it makes the debugging harder.
If the entry assembly was not built with debugging information visual studio will warn you that attaching a debuger run into problems and ask you how you want to proceed.

Automatic
When you attach a debugger manualy to an application or just hit the run button in visual studio with the Debug configuration active it will load symbol files automatically when they can be found in one of the the places listed in the Specify Symbol (.pdb) and Source Files in the Visual Studio Debugger documentation:
- The location that is specified inside the DLL or the executable file. (By default, if you have built a DLL or an executable file on your computer, the linker places the full path and file name of the associated .pdb file inside the DLL or the executable file. The debugger first checks to see if the symbol file exists in the location that is specified inside the DLL or the executable file. This is helpful, because you always have symbols available for code that you have compiled on your computer.)
- .pdb files that could be present in the same folder as the DLL or executable file.
- Any local symbol cache folders.
- Any network, internet, or local symbol servers and locations that are specified on, such as the Microsoft symbol server if enabled.
"Debug" -> "Options" -> "Debugging" -> "Symbols"

Manualy
If you want to load the symbols manually you can load them with the modules dialog. You can right click a row and there is the option "Load Symbols" which lets you specify a PDB file to load.
"Debug" -> "Windows" -> "Modules".

User and non-user code
If the code you are trying to debug is classified as non-user code you need to uncheck Just My Code in the debugging options.
"Debug" -> "Options" -> "Debugging" -> "General"

The following quote from the Microsoft - Visual Studio Docs shows what counts as user and what as non-user code.
To distinguish user code from non-user code, Just My Code looks at symbol (.pdb) files and program optimizations. The debugger considers code to be non-user code when the binary is optimized or when the .pdb file is not available.
Three attributes also affect what the debugger considers to be My Code:
- DebuggerNonUserCodeAttribute tells the debugger that the code it is applied to is not My Code.
- DebuggerHiddenAttribute hides the code from the debugger, even if Just My Code is turned off.
- DebuggerStepThroughAttribute tells the debugger to step through the code it is applied to, rather than step into the code.
All other code is considered to be user code.
Resume
Build your assembly with the default Debug configuration or configure it to inlucde debug information. If possible do not optimize the code. If your IDE is telling you that "No symbols have been loaded for this document" then take a look at the modules window and load them by yourself if possible.


Comments
Post a Comment